
The best crypto trading strategy in 2025: The 4hr chart swing
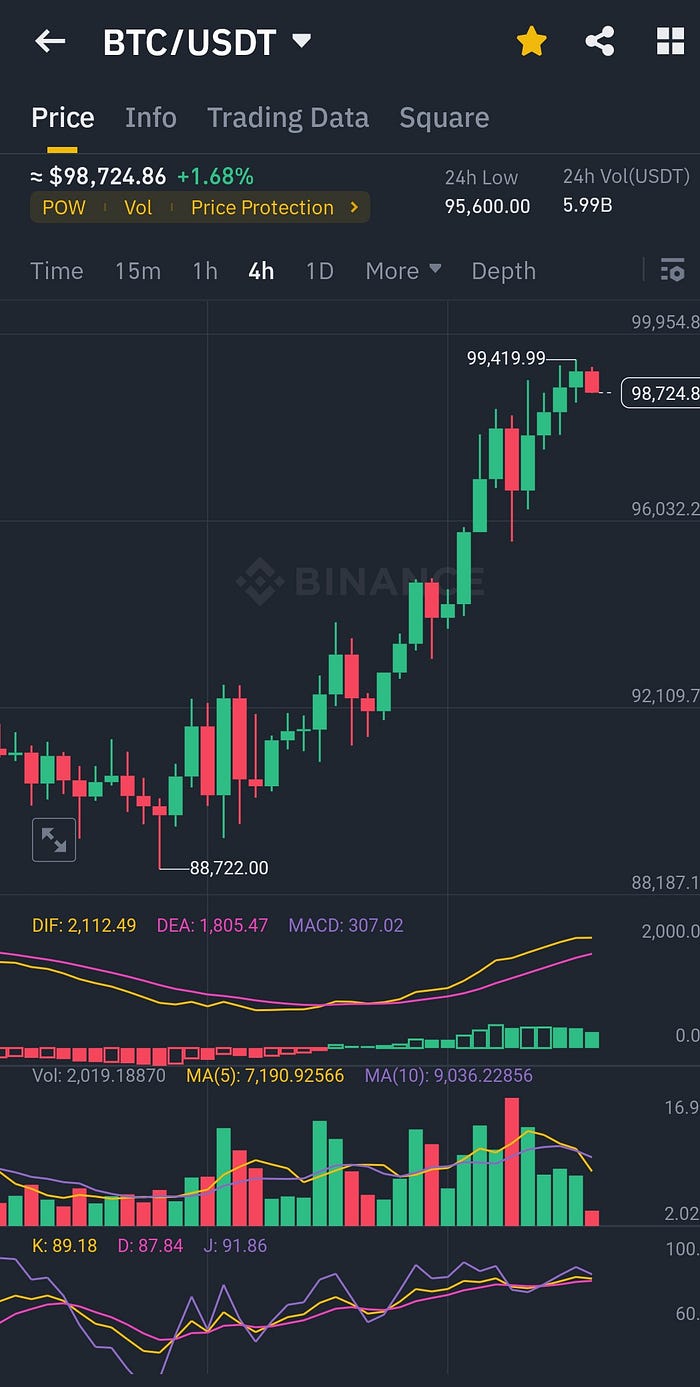
Bitcoin just hit $99,000!
This means that once BTC dominance comes to an end and traders move their funds to alt coins, many coins could do very well (and some already are) making trading very lucrative.
But not all traders are profitable making a proper strategy key when trading.
Trading an asset that is just about to fall is like pulling a door that says push. It will not go in your favour!
That's why I use the 4hr chart swing as my personal strategy.
Learning about the 4hr chart swing was a game changer in my crypto trading journey. I wish I knew about it sooner!
I have been trading crypto on Binance since the pandemic.
It has been a rollercoaster of crazy highs and lows.
I have seen SHIB move 1100% in a month and have seen crazy depressing lows lasting months.
I have also been preaching for people to buy Bitcoin when it had dropped to $15,000 in early 2023.
As I write this it's trading at $97,000. Just last month it was at $63,000.
I started by trading spot, then moved to margin and now I trade futures. In between I write content as it's something I enjoy too while I share my insights.
So yes! I have seen and learnt a lot!
And the learning never stops!
Different market conditions require different mindsets, tact and strategies.
Therefore again, the learning is constant.
I keep improving my trading strategy as I gain more experience tweaking it to make it a smoother process when navigating different market conditions.
The 4hr chart swing trade has been the game changer for me as I mentioned.
What and why the 4hr chart swing?
- The 4hr chart is the core chart many traders use when trading.
- The lower time frame charts such as the 1 hour, 15 minutes charts etc may be too noisy moving up and down too frequently which can hinder proper forecasting in the long term.
- The higher chart time frames such as the 6 hour and 8 hour could be too rigid to help with more precise prediction.
- This leaves the 4 hour chart as the most suitable leading many traders to trade its swing.
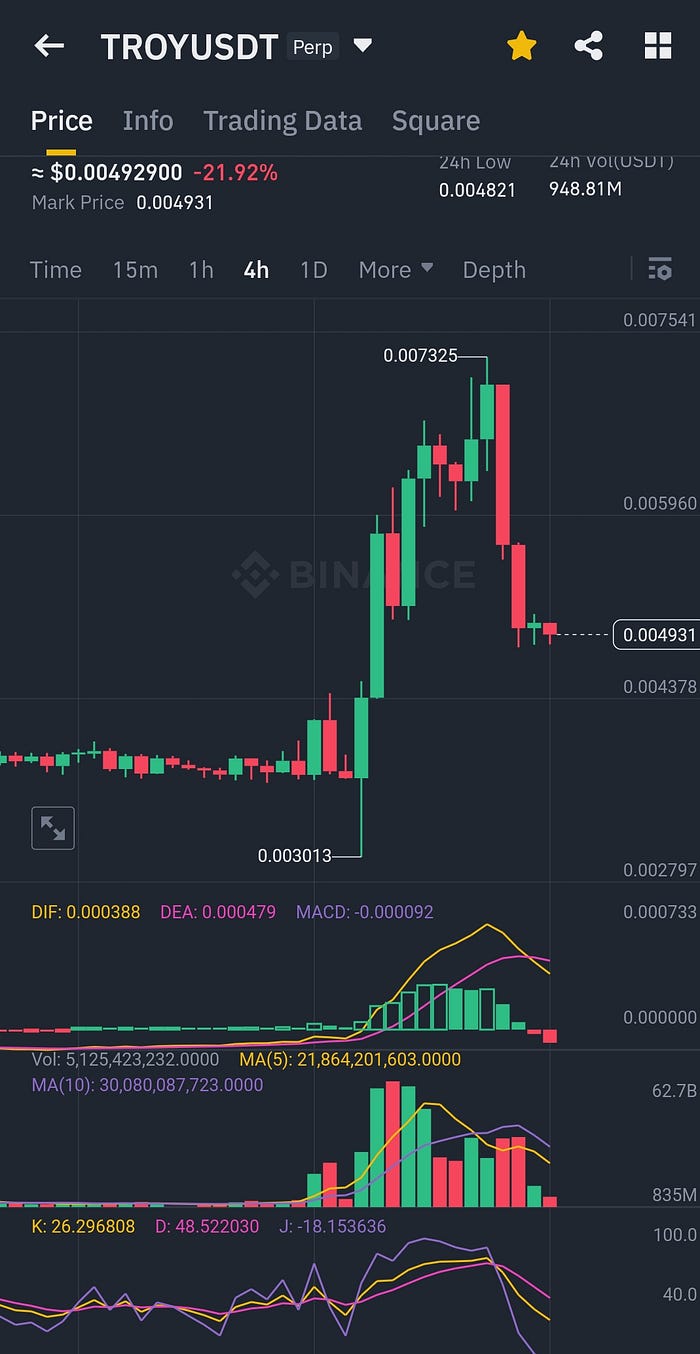
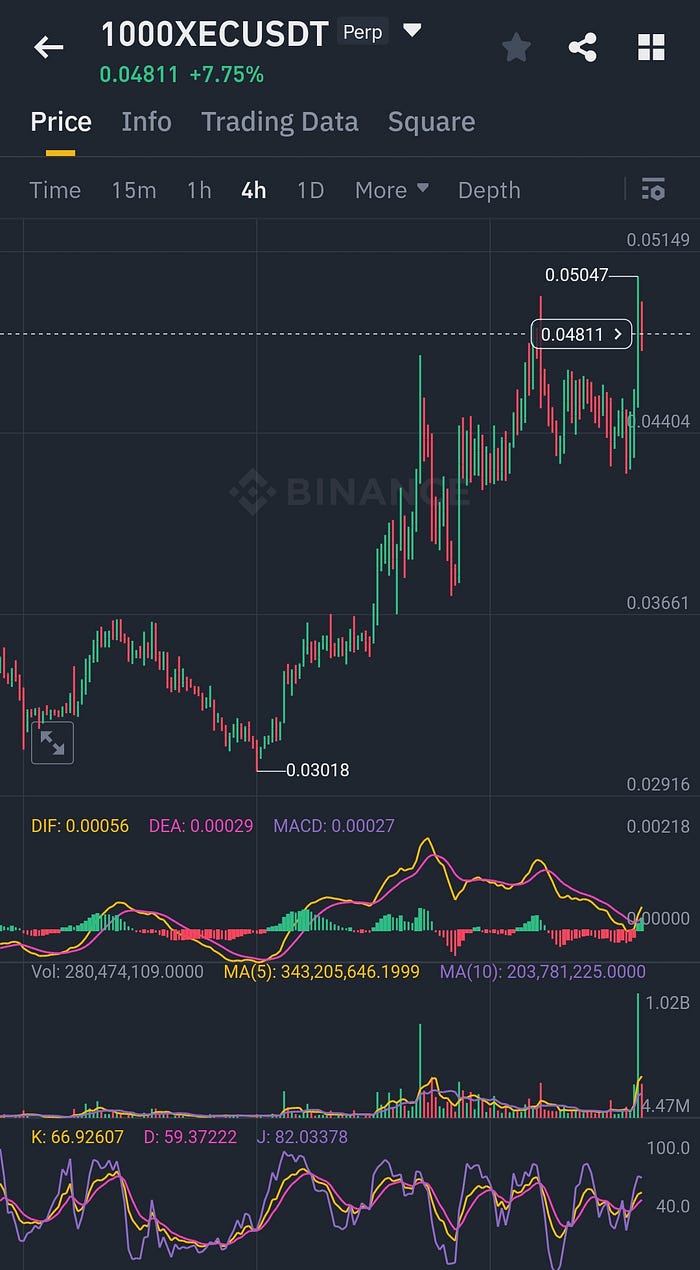
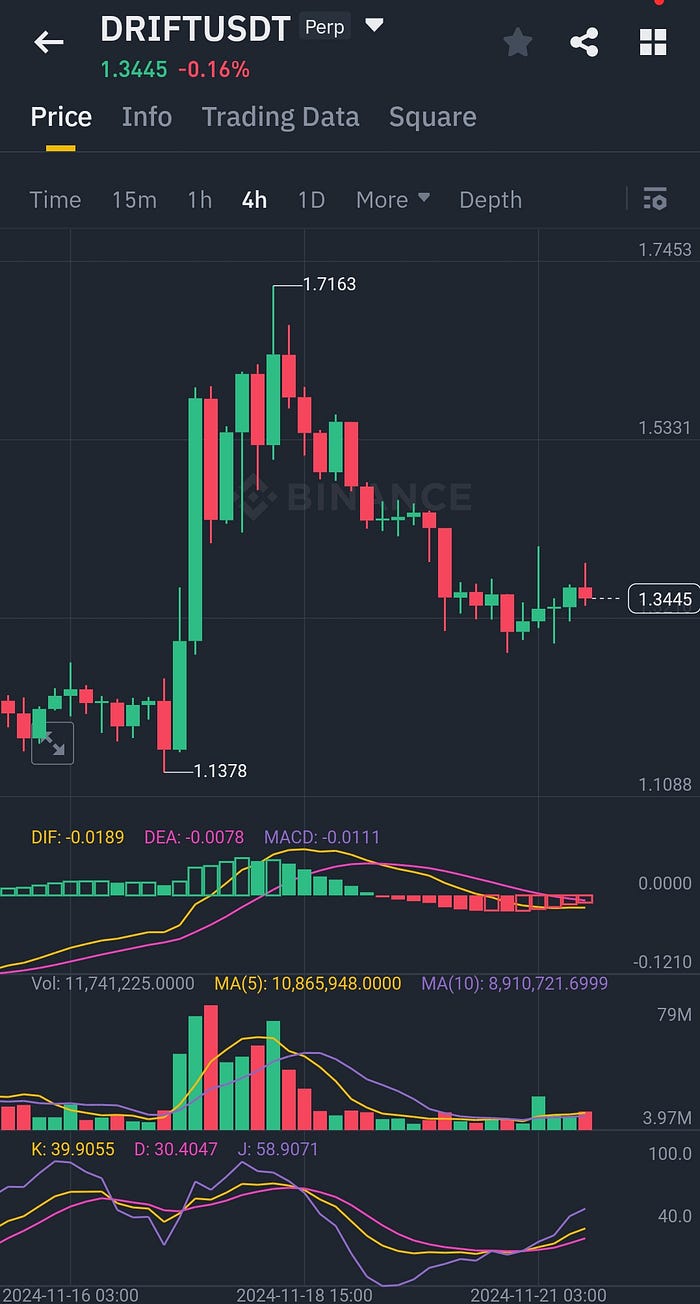
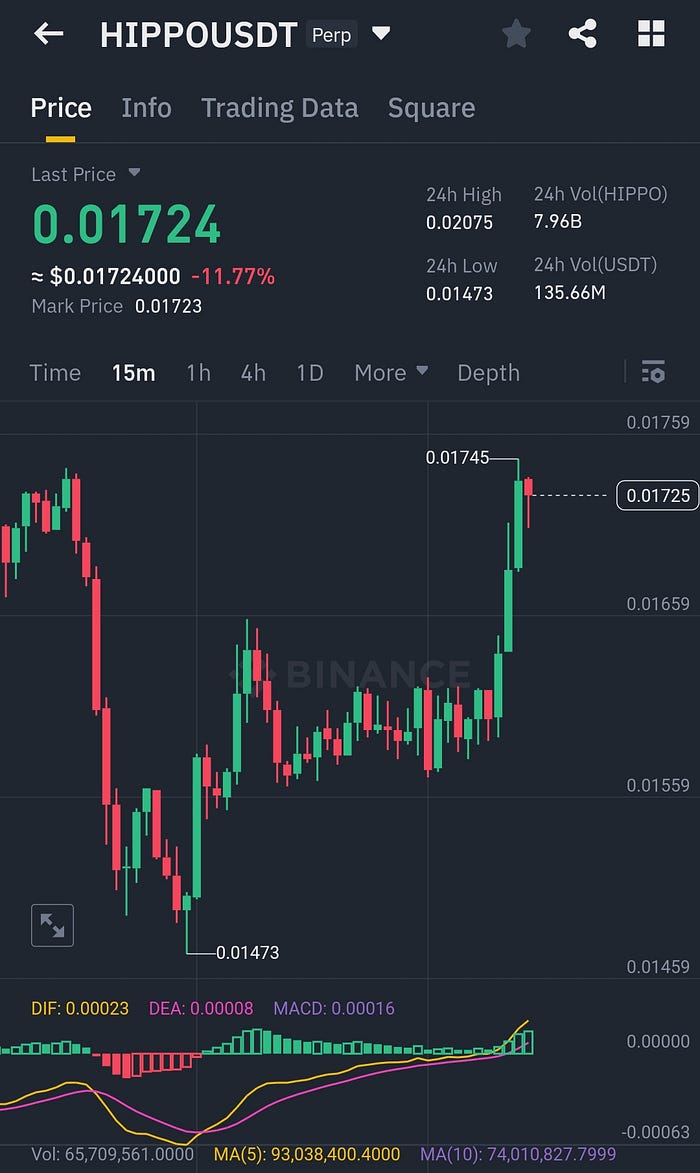
- When you look at the charts below you can see a clear market movement on the 4 hour chart.
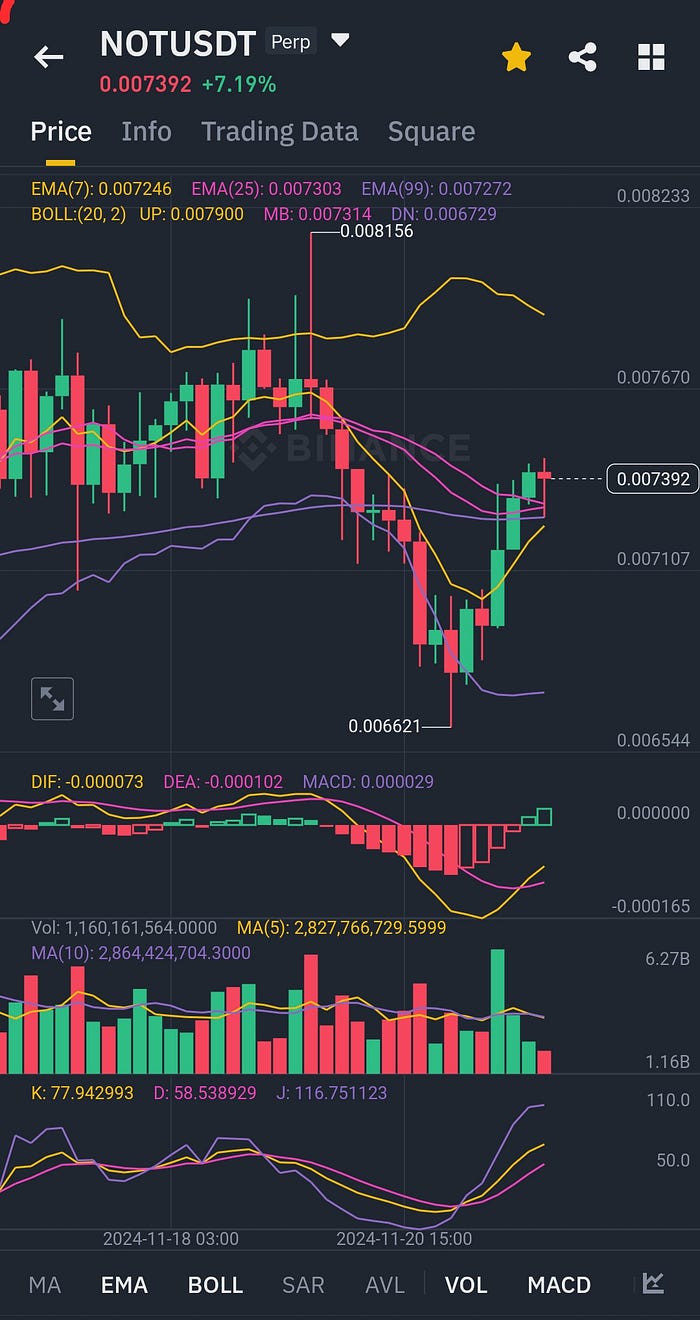
- When MACD turns positive on the 4hour chart, it is highly likely that the asset is going to rise. The KDJ indicator detects this earlier but MACD confirms it.
- Of course there are no absolutes in trading because the market does experience anomalies from time to time but the 4hr chart is the most reliable time frame for this strategy.
Here are the steps when trading spot, margin or futures.
These guidelines are targeted at complete beginners or experienced traders who are looking to settle on a specific trading strategy.
- Begin at the beginning of a new trading day or whenever you usually notice a spike or good and clear market movement.
- I prefer to begin to trade at the beginning of a new trading day on Binance as markets are more clear to me. Read more on this here.
- Different exchanges from all over the world open at different times and these market openings may sometimes affect market movement. Finding out when these markets movements happen specific to your local time would be helpful in your trading.
2. Check how BTC is doing and where it is on the 4hr chart. If it's falling there there might be a market drop. If it's rising markets could go up.
- Always remember that Bitcoin is king and it's movement determines the movement of the overall market.
- If it's falling many assets will be falling. If it's rising many other assets will be rising with it.
- Note that there are exceptions though particularly when BTC is super bullish and Bitcoin dominance comes in and traders choose to trade it over other assets or when it's alt season etc.
3. Look where the coin you are analysing is in the 4hr time frame. If it's at the beginning the better.
- This is checked by observing MACD.
- When the DIF line crosses over upwards over the DEA line it brings a positive MACD meaning the trend is highly likely going to be bullish. The reverse also applies.
- This can also be observed on KDJ when the K line crosses upwards over the D line. The reverse also applies.
- Note that even though MACD and KDJ indicators move in the same direction they sometimes give contradictory signals as MACD is a lagging indicator showing market movement after it has already happened while KDJ is a leading indicator showing the market movement before it happens. Therefore experience and tact is key here.
- KDJ predicts markets more accurately in the short term and can be very useful for scalpers looking to make quick entry and exit points.
- It also supports the function of RSI showing overbought and oversold market conditions with the K and J lines.
- KDJ can predict a fall or rise earlier especially in the smaller time frames which can be noisy for a trader looking to stick to an asset longer. MACD can be a bit steady in these predictions so tactfully using the two together is key.
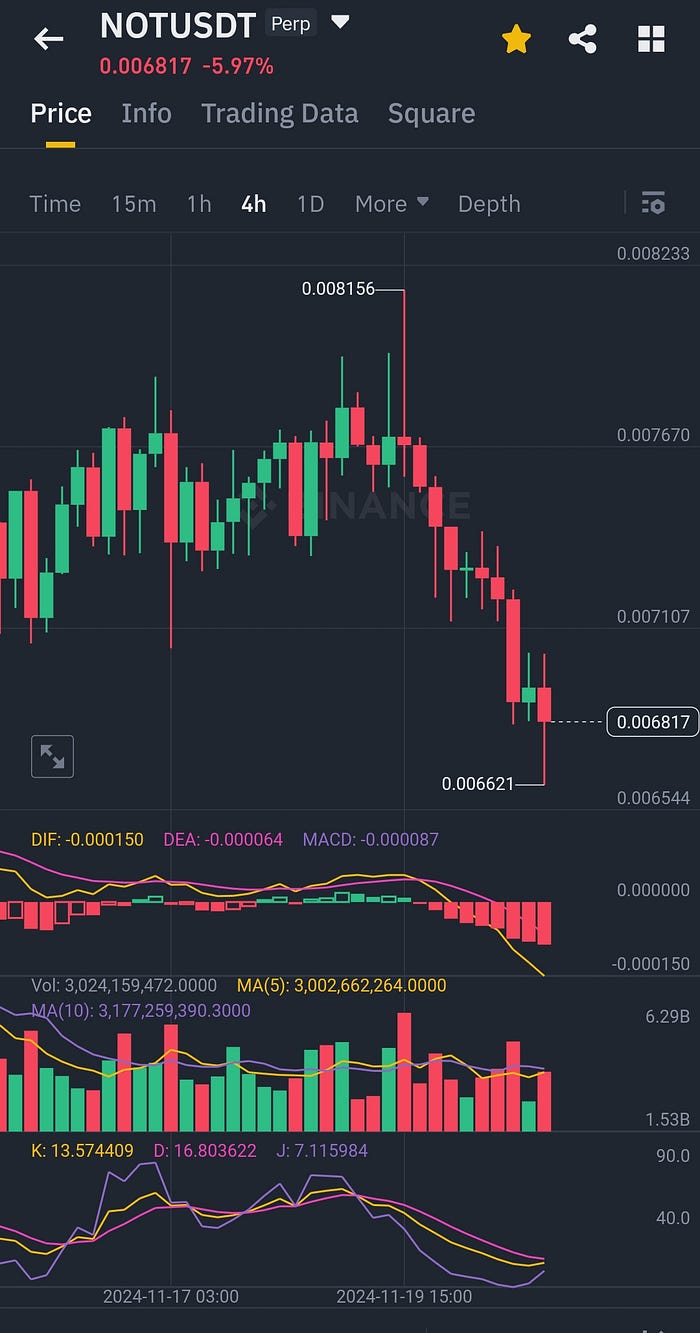
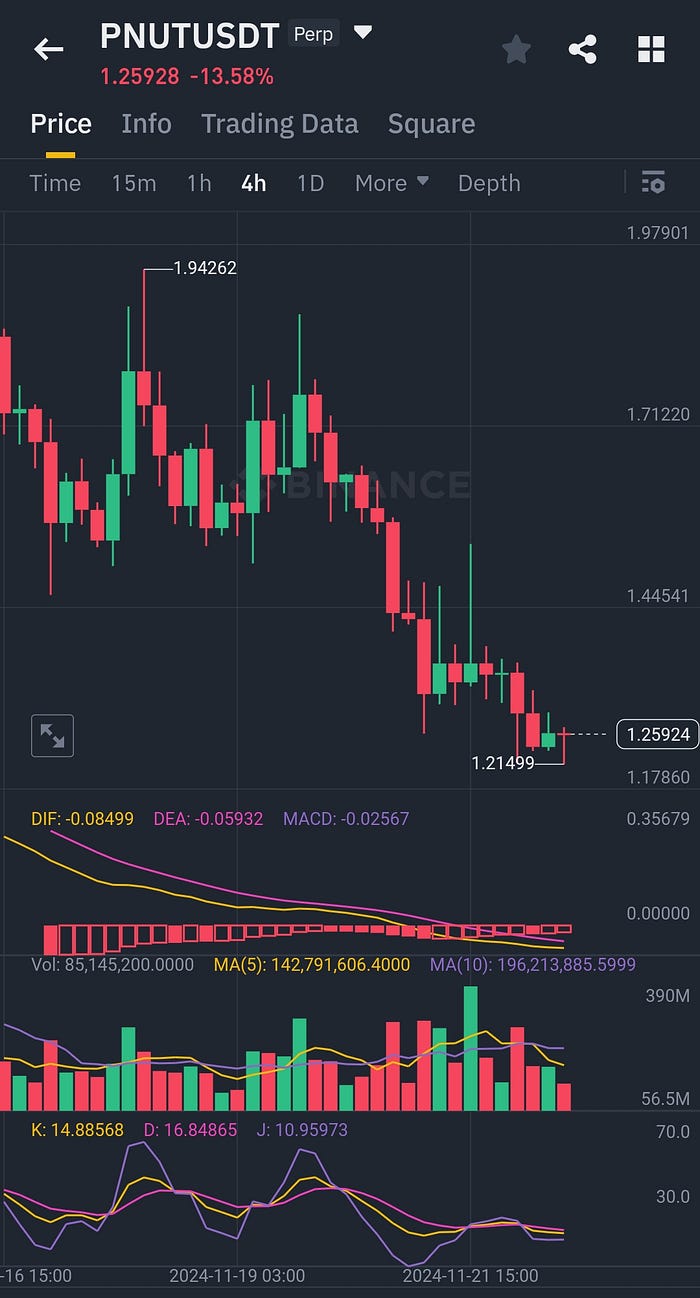
From the above chart, you can see that once MACD crossed over downwards on the 4hr chart the asset began to fall significantly.
The K line looks like it's about to cross over upwards using the KDJ chart meaning that the downward trend could be over for the moment and the asset could begin to rise again. When MACD turns positive this would be confirmed.
- Learn more about these indicators and what they measure from as many different sources as you can to thoroughly understand them.
4. Look for a strong bullish trend on every time frame from 1 minute to 1 month.
- The more of these frames signify that the trend is bullish the better. Tact and experience will help you handle false, confusing or contradicting signals and charts.
- Three green candlesticks and more following each other is a strong indicator of the start of a bullish trend. If they show in all chart frames the better.
- Three red candlesticks following each other is a strong indicator that the asset could fall.
- One indicator cannot be sufficiently used in isolation as none can predict the market with 100% accuracy all the time. So confirm market movements with other indicators such as volumes and RSI and use them together as you trade.
- When volumes are green it shows that they are more buyers and the coin could be going up and when red it shows that there are more sellers than buyers and the asset could be falling. The size of the volume bars also show how big the rise or fall is.
- When RSI is at 30, it shows that the asset has been oversold at that specific time frame and could rise. If it's above 70 it shows that it has been overbought and could come down crushing. This is also measured by the K and J line of KDJ.
- Again tact is key here as an asset above 70 could keep rising which would be very risky for margin and futures traders as it could lead to a liquidation depending on their position sizing.
- When Bollinger bands are squeezing it shows that the asset could rise. If they are far apart, it shows that it could fall in that specific time frame.
- Familiarize yourself with candlesticks, charts and their patterns to help you predict asset movement. This comes with experience.
- Be tactical when checking and confirming movement with different indicators as again sometimes they can give contradicting information.
- With the many different indicators available, I usually choose to focus on just a few to minimize the noise and help with entry and exit decision making. Overusing different indicators can be detrimental to trading sometimes from experience.
- Once you understand one indicator thoroughly, use this knowledge and understanding to interpret the others relative to the one that is clear to you.
5. Check support and resistances on every time frame especially resistances. They will help you know where to enter and when to exit.
- Traders trade support and resistances.
- Support shows a potential resting point for a falling asset which could help determine an entry point when confirmed with all other indicators.
- A resistance shows the point where a rising asset could stop at which could help determine a potential exit point for a trader.
- Every time frame has its own support and resistance levels from the 1 minute to the 1 month.
- When scalping use support and resistances as possible entry and exit points. If one is successfully broken in a time frame, watch out for the next as a possible exit or entry point.
Here's a quick and concise break down of how I do it.
1. I begin at 00:00 UTC the beginning of a new trading day on Binance.
2. I check how BTC is doing as its movements affect the overall market.
3. I start analyzing assets. First the top performers and the biggest losers.
4. I look for a bullish trend in them on the 4hr chart. Here MACD should have successfully crossed over on this chart. I use KDJ as the leading indicator showing whether MACD on the 4hr chart might cross over upwards soon. RSI is also helpful to determine overbought and oversold coins.
5. I avoid all coins whose MACD is too high on the swing in the 4hr chart and it's about to cross over downwards and those where it has not successfully crossed over upwards unless I intend to short in futures trading.
6. I then check the other time frames looking for patterns and bullish trends. I have heavily invested in learning technical analysis for this.
7. When I identify the specific coin with a bullish trend that I wish to trade, I check support and resistances to determine a possible entry and exit point.
8. When this is sufficient, and the signal is confirmed, I enter the trade and exit at my exit point a place just below the next significant resistance level. Sometimes it may takes minutes, sometimes hours and even days to exit a trade.
And voila! I complete a trade.
Now, how to make $100 a day using the 4hr chart swing
For spot trading
To make $100 a day trade a significant account such as $1000. Target a 10% rise using the steps outlined above and you will have made your $100 daily.
If you trade a $500 account, target a 20% rise to make your $100.
With tact you can make more than $100 in a day on a good trade.
While some assets may rise even up to 200% in a day sometimes they barely do 15% so trading a bigger account is easier and less hectic to make your $100 daily.
If you are trading a $50 account you would have to enter several different trades in a day to make your $100. This can be hectic and could lead to over trading and the mistakes and losses that come with it.
Beginners are encouraged to start with a small amount though as they learn to navigate the markets.
For margin trading
For futures trading
Futures trading is far too complex to be compressed into a single straight forward strategy because of the many different factors involved such as position sizing, one way or hedge mode, funding fees etc.
$10 could make you $200 in a single trade depending on your position size and use of margin. While you can lose $1000 in seconds based on the same factors.
The core goal of any futures traders would be to avoid getting liquidated and losing their capital before making profits.
Below is a guideline on how to avoid liquidation in futures trading.
Beginners should not attempt to trade futures. Master spot and margin trading before moving to futures trading.
Points that will help you achieve success at trading
- Learn technical analysis and be very good at it to identify trends and be able to predict market movement with more accuracy. Ofcourse TA is not 100% reliable but it is very helpful. Combining it with fundamental analysis, tact and experience is very useful.
- To understand chart movements particularly for beginners, select 5 different assets and follow them steadily on every time frame while taking notes for at least a month it will help make them clearer when you begin to trade.
- Trading is very much about psychology so having the patient to wait until an asset gives you a bullish signal on the 4hr chart is key. If you can cultivate this, you are halfway there. You do not want to enter a trade when the signal has not yet been confirmed. Believe you me I have been there! You might be stuck in a sideways movement which can be frustrating, annoying even or might be caught in a bull trap. The asset could also keep falling leading to losses.
- Yes size does matter. Trade a significant account so as not to be desperately trying to grow a small account. A significant account is different to different people though. It could be $100 for some and $20,000 for others. Trade the account that is best suited for your financial situation. But beginners are advised to start with a small account as they learn because the losses are real!
- Begin to trade when markets are good and there are good volumes.
- Enter trades at the beginning of new time frames because this is when major movements happen. Analyse what you anticipate the coin will do then enter the market at the next time frame. If it's not making sense of the 5min chart wait and see what it will do on the next or on the 15 min chart. If it's not making sense of the 4hr chart wait and see what it could do on the next 4hr chart. If it's 6:57 wait and see what the asset will do at 7:00 etc. If it's 30th January, wait and see what it will on on 1st February. This is particularly important when scalping. Holders and swing traders can tactfully navigate this. This goes hand in hand with waiting for the signal to be confirmed.
- Keep track of the coins you have already analysed by favoriting them as you wait for the trend to reverse. This will save you time and energy and will reduce the overwhelm of trading particularly for scalpers.
- Avoid trading or trade cautiously when charts are not clear to you to avoid losses. In extreme markets, have the patience and discipline to wait for the calm to determine a good entry point.
- When markets are not doing well, follow the market and not your wishes. Avoid forcing profits when the market is falling to avoid losses. As they are tides, rising and falling constantly, wait for the next good opportunity to make profits.
- Have a personal trading strategy tailored to your specific needs. This includes the times you can trade, targeted profits, long or short, holding or scalping etc.
- Trade carefully especially in bull markets. Remember markets fall faster than they rise because fear can be a stronger emotion than greed. And whales are well known to trap small traders.
- Avoid over trading. I'd rather do 5 good trades than 100 trades where half could be losing trades. I don't think the agony is worth it. Trading is no joke and constantly staring at charts all day is not a life. Take breaks from charts and the markets from time to time. In the process of trading, caring for your physical, mental and emotional health should be top priority.
- Do not be too hard on yourself also. No trader can execute perfect trades all the time entering and exiting the market at the most profitable points. Instead, learn from your mistakes and from others.
This story also contains the personal experiences and opinions of the author. It is intended for guidance purposes only and should not be taken as professional advice. Please consult a certified professional when in need.
Join Binance today and receive $300 worth of free crypto!!!! It will come in very handy when offsetting your trading fees. Join Binance now by clicking here.
You will also be interested in…
1. How to make $100 a day trading crypto
2. How to trade cryptocurrency on the spot market 3. How to trade cryptocurrency on margin with screenshots 4. 15 Frequently asked questions about crypto trading
Interested in detailed lessons and live chart reading? Contact me on galmux14@gmail.com