
I really enjoy financial data analysis in trading. I have my bots running which do well, but it's got to the stage where I just leave them to do their thing.
When you watch markets closely over a period of time (especially with crypto), you notice that the price tends to move between an upper and lower limit. I'm not sure if it's a support or resistance exactly. I just know that if I see the price go below a certain value then it's a good time to buy and if it exceeds a value it's a good time to sell. It's more of a "gut feel" which almost always works out. I usually just place limit orders to buy and sell and just leave them to execute.
It got me thinking if there was a way to turn the "gut feel" into something tangible, and I think I've done it.
The Concept
In the month of May 2023, how many times did the Bitcoin price reach the same value?
Take the highest occurrences where this happened and extract the highest and lowest price.
Plot it on a graph to see what it looks like.
The Steps
1. Load the necessary libraries
import yfinance as yf
import pandas as pd
import matplotlib.pyplot as plt
2. Define our variables
SYMBOL = "BTC-GBP"
START_DATE = "2023-05-01"
END_DATE = "2023-05-31"
3. Retrieve our daily market data for BTC-GBP
df = yf.download(SYMBOL, start=START_DATE, end=END_DATE)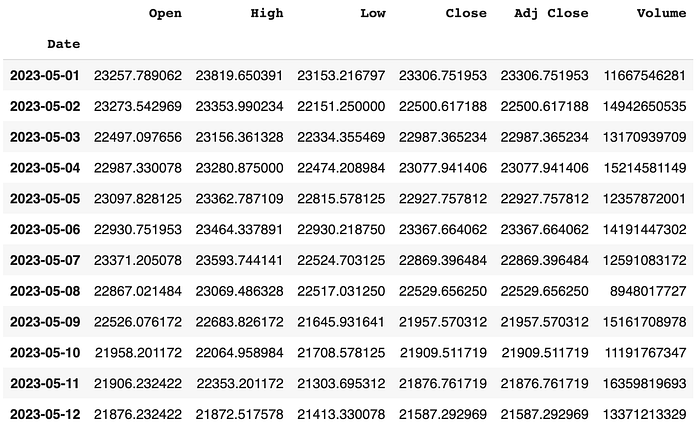
Now for this to work we will need to round the "Adj Close" to something sensible for BTC-GBP. This really would be dependant on the market price.
4. Round the "Adj Close" to something sensible.
ROUND_TO_NEAREST = 50

df["Rounded Adj Close"] = (df["Adj Close"] / ROUND_TO_NEAREST).round() * ROUND_TO_NEAREST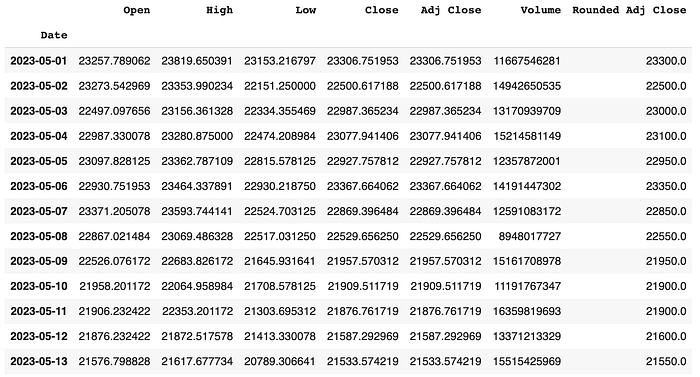
We now have a new feature called "Rounded Adj Close" which is the "Adj Close" rounded to the nearest 50 Pounds.
5. Store the top 5 occurrences of the "Rounded Adj Close" in "counts"
counts = df["Rounded Adj Close"].value_counts().head(5)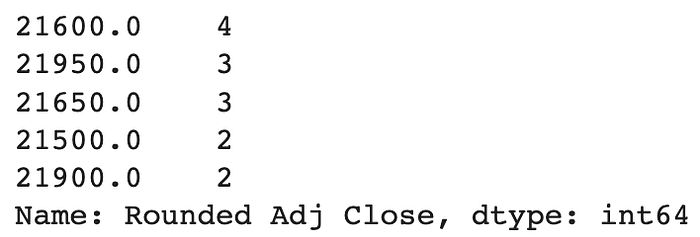
6. Store the highest and lowest "Rounded Adj Close" in variables
min_close = counts.index.min()
max_close = counts.index.max()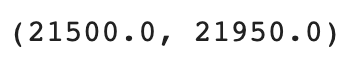
7. Display the days where the minimum condition is met
df[df["Rounded Adj Close"] == min_close]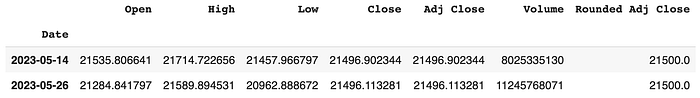
8. Display the days where the minimum condition is met
df[df["Rounded Adj Close"] == max_close]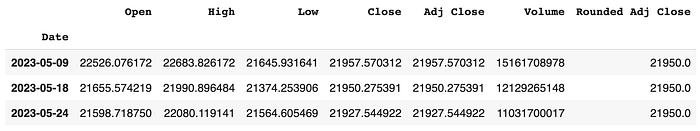
9. Plot this to show this visually
plt.figure(figsize=(30,10))
plt.plot(df["Adj Close"], color="black", label="Close")
plt.axhline(y=min_close, color="r", linestyle="--")
plt.axhline(y=max_close, color="g", linestyle="--")
plt.ylabel("Close")
plt.xticks(rotation=90)
plt.title("BTC-GBP")
plt.legend()
plt.show()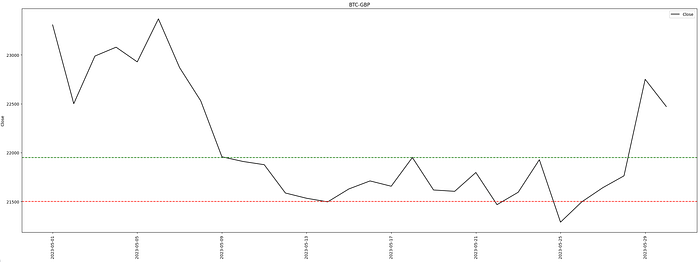
Conclusion
The general idea is to place your limit order buys 21500, and your limit order sells at 21950, and just keep repeating this process after each order is executed. As you can see above in May 2023, if you did that you would have several successful trades in the month.
This should work with any market or time interval. You may just need to adjust the "ROUND_TO_NEAREST" to something that would be appropriate for the price.
You will want to repeat this process, possibly monthly, to establish the new minimum and maximum values.
Disclaimer
This method is an attempt to explain what I do for manual trades. I entered the Reply Crypto Investment Challenge last month and I placed 64th out of 800 using this method alone. I made 2.62% in two weeks. Those who placed higher than me were actively day trading. I just placed and checked my orders once a day and I still made a profit.
I hope you found this article interesting and useful. If you would like to be kept informed, please don't forget to follow me and sign up to my email notifications.
Michael Whittle
- If you enjoyed this, please follow me on Medium
- For more interesting articles, please follow my publication
- Interested in collaborating? Let's connect on LinkedIn
- Support me and other Medium writers by signing up here
- Please don't forget to clap for the article :) ← Thank you!