There are so many trading strategies and candlestick patterns out there, but the question is — how do you measure the performance?
The simulation feature of my free open source trading bot project is really popular. There are many articles published about it in my Medium publication, Trading Data Analysis. Feel free to follow the publication for updates on the project, it's called PyCryptoBot.
I wanted to develop a backtesting framework using the data science Pandas library for Python. I've created a proof of concept for it, and it's working well.
I will talk you through the thought process I went through while creating it.
What will we need?
- Trading data converted into a Pandas dataframe (date, open, high, close, low, volume)
- Configurable test settings (buy_order_quote, buy_order_base, is_order_open)
- Apply our buy and sell signals in some form to our data (set_buy_signals, set_sell_signals)
- We will need to be able to iterate through our data (in this case our Pandas dataframe)
- Log the outcome of each completed order
Building up the code
I've actually completed the proof of concept (POC) / minimum viable product (MVP) for this already. It's by no means complete but it's a start, and it's working. I've put the code in a public Github repo using the Apache License Version 2.0, so feel free to either contribute to it or create something of your own.
Generally speaking, your Python applications should start like this…
# pandas-bt.py
import sys
def main() -> int:
    """Backtest a strategy using pandas"""
    return 0
if __name__ == '__main__':
    sys.exit(main())
We are going to need to get your trading data from somewhere, and there are many options available. Some free and some paid for. As I like my readers to be able to follow along, I don't really like to use anything that doesn't have a free option.
There are also two main methods for importing trading data. You can either download a copy from a service like Yahoo Finance or TradingView and import it in Python, or you can use an API call to an exchange to retrieve the data directly. This is what we will be doing here as it's quickest and easiest.
Our stub function will look like this:
import pandas as pd
def get_ohlc_data() -> pd.DataFrame:
    """Return a DataFrame of OHLC data"""
    return pd.DataFrame([], columns=["date", "open", "high", "low", "close"])
I've called the function, "get_ohlc_data", because I wanted it to be generic and re-usable. It doesn't really matter how you import your data in this function but you want it to return a Pandas DataFrame with the columns "date", "open", "high", "low", and "close". You may need to do some pre-processing of your data to get it into this format. For example some exchanges have "adj_close" instead of "close", or they may have a different name or format for the "date".
Now let's add some meat to the bone…
def get_ohlc_data() -> pd.DataFrame:
    """Return a DataFrame of OHLC data"""
market = "BTC-GBP"
    granularity = 3600
    resp = requests.get(
        f"https://api.pro.coinbase.com/products/{market}/candles?granularity={granularity}"
    )
    df = pd.DataFrame.from_dict(resp.json())
df.columns = ["epoch", "open", "high", "close", "low", "volume"]
    tsidx = pd.DatetimeIndex(
        pd.to_datetime(df["epoch"], unit="s"), dtype="datetime64[ns]"
    )
    df.set_index(tsidx, inplace=True)
    df = df.drop(columns=["epoch"])
    df.index.names = ["ts"]
    df["date"] = df.index
return df[["date", "open", "high", "close", "low", "volume"]].iloc[::-1]
And if we print get_ohlc_data() now, we get this.
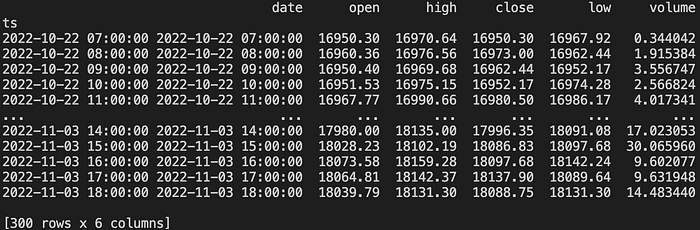
Here are 300 hours of Bitcoin hourly data from Coinbase Pro. I just wanted to reiterate that this can be any OHLC data, stocks or cryptocurrencies. As long as it's in this format, you are good to go.
Point 1 is completed from our "What will we need?" list.
For Point 2, we will need to configure some backtesting settings.
def main() -> int:
    """Backtest a strategy using pandas"""
    # initialisation values
    market = "BTC-GBP"
    granularity = 3600
    balance_base = 0
    buy_order_quote = 1000
    is_order_open = False
    orders = []
    print(get_ohlc_data())
return 0- "market" is purely descriptive for our list of orders. If your solution uses an API call, you could integrate this into your API call to make it more dynamic. I didn't want to over complicate this example to make it easier to understand.
- "granularity" is also purely descriptive for our list of orders. It is the time frame used in our data. Sometimes also referred to as "interval" or "frequency".
- "balance_base" is the amount of the asset we hold, in this case Bitcoin.
- "buy_order_quote" is our virtual amount of funds to place buy orders with. As we are using the BTC-GBP market above, the quote amount would be £1000. It's really a made up number as you would need something at least to start trading in the real world.
- "is_order_open" is just a variable to keep track if an order is open or not.
- "orders" is a list of orders we'll track with our backtesting
Point 2 is completed from our "What will we need?" list.
Point 3 is really the more interesting part. This is where you define your entry and exit points. It can be literally anything. You can do this programmatically using an algorithmic strategy or you can manually do it yourself. In order to demonstrate this I'm going to show you how to manually set your entry and exit points. It's very unlikely you will ever want to do this but it will be easier to explain this part first.
This is where we create our "set_buy_signals" and "set_sell_signals" functions. These functions are deliberately generic, to apply whatever signals you wish. This will take in the OHLC Pandas DataFrame as an input and return the same Pandas DataFrame with the new "buy_signal" and "sell_signal" columns.
def set_buy_signals(df: pd.DataFrame) -> pd.DataFrame:
    """Set buy signals"""
    df["buy_signal"] = 0
    # custom code here
    df.at["2022-11-03 14:00:00", "buy_signal"] = 1
    return df

def set_sell_signals(df: pd.DataFrame) -> pd.DataFrame:
    """Set buy signals"""
    df["sell_signal"] = 0
    # custom code here
    df.at["2022-11-03 18:00:00", "sell_signal"] = 1
    return df
I've highlighted the part which is the "custom" part of these functions. It's doing something very basic. For the buy it's locating the index, "2022–11–03 14:00:00" and setting the "buy_signal" to 1. For the sell it's locating the index, "2022–11–03 18:00:00" and setting the "sell_signal" to 1. Now I've just randomly picked two timestamps. Zero analysis was done here as it's just an example.
In our "main()" function we'll want to do this, before the "return 0".
df = get_ohlc_data()
df = set_buy_signals(df)
df = set_sell_signals(df)
print(df)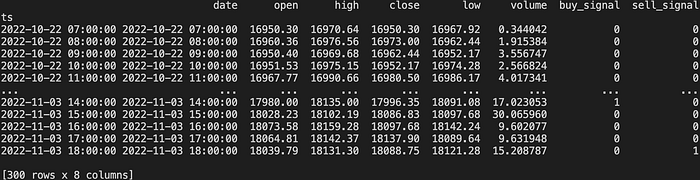
You will see two new columns added for "buy_signal" and "sell_signal". If you look at the last 5 hours of data at 2pm you will see the buy and at 6pm you will see the sell.
Point 3 is completed from our "What will we need?" list.
Point 4 is where is starts getting a little more complicated. This is where we want to iterate through our dataset and process the buy and sell signals. It's going to look something like this.
def main() -> int:
    """Backtest a strategy using pandas"""
    # initialisation values
    market = "BTC-GBP"
    granularity = 3600
    balance_base = 0
    buy_order_quote = 1000
    is_order_open = False
    orders = []
    df = get_ohlc_data()
    df = set_buy_signals(df)
    df = set_sell_signals(df)
    for index, row in df.iterrows():
        if row["buy_signal"] and is_order_open == 0:
            is_order_open = 1
            print("buy")
    if row["sell_signal"] and is_order_open == 1:
            is_order_open = 0
            print("sell")
    return 0
The buy part of my main function looks like this now.
for index, row in df.iterrows():
    if row["buy_signal"] and is_order_open == 0:
        is_order_open = 1
        buy_amount = buy_order_quote / row["close"]
        balance_base += buy_amount
        balance_quote -= buy_order_quote
        order = {
            "timestamp": str(row["date"]),
            "market": market,
            "granularity": granularity,
            "balance_open": balance_quote,
            "buy_order_quote": buy_order_quote,
            "buy_order_base": buy_amount
        }
        print(order)
Which results in this, so far.
{'timestamp': '2022-11-03 14:00:00', 'market': 'BTC-GBP', 'granularity': 3600, 'balance_open': 0, 'buy_order_quote': 1000, 'buy_order_base': 0.05556682327249693}And now for the sell…
if row["sell_signal"] and is_order_open == 1:
    is_order_open = 0
    sell_value = buy_amount * row["close"]
    balance_quote += sell_value
    balance_base -= buy_amount
    order["sell_order_quote"] = sell_value
    order["balance_close"] = balance_quote
    order["profit"] = order["sell_order_quote"] -    order["buy_order_quote"]
    order["margin"] = (order["profit"] / order["buy_order_quote"]) * 100
    print(order)
    orders.append(order)
Which results in this.
{'timestamp': '2022-11-03 14:00:00', 'market': 'BTC-GBP', 'granularity': 3600, 'balance_open': 0, 'buy_order_quote': 1000, 'buy_order_base': 0.05556682327249693}
{'timestamp': '2022-11-03 14:00:00', 'market': 'BTC-GBP', 'granularity': 3600, 'balance_open': 0, 'buy_order_quote': 1000, 'buy_order_base': 0.05556682327249693, 'sell_order_quote': 1005.1343744703788, 'balance_close': 1005.1343744703788, 'profit': 5.134374470378816, 'margin': 0.5134374470378816}
That's a little amusing. I literally just picked a random entry and exit point and made a profit (virtually that is). The part to note is that the closing balance "balance_close" after the last trade is 1005.1343744703788. That is the initial £1000 we started with plus the £5.13 profit on the single trade.
Point 4 is completed from our "What will we need?" list.
At the end of processing we will now have an array (or list in Python) of all our orders stored in orders[]. What we want to do now is load this into a new Pandas DataFrame which will be a lot nicer to analyse. All we need to do is add the two lines in bold above the "return 0" in "main()".
df_orders = pd.DataFrame(orders)
print(df_orders)
return 0
Will will result in this.

We now may want to improve on this and apply an algorithmic strategy. A basic EMA12/26 crossovers strategy should be easy enough to demonstrate, although there are a lot of code updates. If you would like to check out the Github repo, you can find it here.
I added at the top of the main.py function, below the imports.
pd.options.mode.chained_assignment = NonePandas will give some warnings, but they are just warnings and can be ignored.
I created a new function called, "add_ema1226".
def add_ema1226(df: pd.DataFrame) -> pd.DataFrame:
    """Add EMA12 and EMA26"""
    df["ema12"] = df["close"].ewm(span=12, adjust=False).mean()
    df["ema26"] = df["close"].ewm(span=26, adjust=False).mean()
    df.loc[df["ema12"] > df["ema26"], "ema12gtema26"] = True
    df["ema12gtema26"].fillna(False, inplace=True)
    df.loc[df["ema12"] < df["ema26"], "ema12ltema26"] = True
    df["ema12ltema26"].fillna(False, inplace=True)
    df["ema12gtema26co"] = df.ema12gtema26.ne(df.ema12gtema26.shift())
    df.loc[df["ema12gtema26"] == False, "ema12gtema26co"] = False
    df["ema12ltema26co"] =     df.ema12ltema26.ne(df.ema12ltema26.shift())
    df.loc[df["ema12ltema26"] == False, "ema12ltema26co"] = False
    return df
I've covered this in detail in my previous articles, what this is actually doing. You will find the articles in my Medium publication, Trading Data Analysis. I go into a lot of detail about what this code is actually doing. Feel free to follow the publication to be kept updated with interesting articles.
In my "main" function, I included the new "add_ema1226" function call.
df = get_ohlc_data()
df = add_ema1226(df)
df = set_buy_signals(df)
df = set_sell_signals(df)
And run the script again, and it just works :)
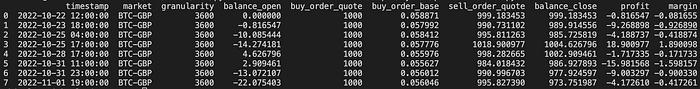
As you can see an EMA12/26 strategy to trade Bitcoin right now is not advisable. There is one decent win there but the rest are losses. I'm not really surprised as the markets are in a shambles at the moment. I'm looking forward to the next bull market and to fire up my trading bots again. You will need to apply another strategy to work better in poor market conditions but that's a topic for another day.
I hope you found this article interesting and useful. If you would like to be kept informed, please don't forget to follow me and sign up to my email notifications.
Michael Whittle
- If you enjoyed this, please follow me on Medium
- For more interesting articles, please follow my publication
- Interested in collaborating? Let's connect on LinkedIn
- Support me and other Medium writers by signing up here
- Please don't forget to clap for the article :) ← Thank you!