Background
I started trading as a sophomore in high school when I learned about the stock market by talking to my microeconomics teacher, a former broker at the NYSE. This time in high school was crucial to my development because I had a lot of spare time and a deep desire to learn about the markets.
I spent hundreds and hundreds of hours studying charts, doing deep dives into market structure, and absorbing knowledge from mentors like Pradeep Bonde and Kristjan Qüllamaggie. I was lucky to find these people early on because they shaved years off my learning curve. I was not profitable, and in fact, I lost most of my money multiple times, but I kept trying repeatedly.
Most people fail at trading because they're not built for constant failure. No one is. It's a skill you learn when you have an inextinguishable passion. Looking back on it, it truly is bizarre to keep trying something with virtually no odds of success. But that's what I did for years, and it was essential because I think I learned more about the stock market during that time than I would have ever thought possible.
The purpose of this post is to pull back the curtains of what I learned during my time studying the market. I want to get into a high-level overview of my process explaining everything from the setups I'm executing to what markets I actively trade in. I'll also include example charts!
Just a little disclaimer, though, whatever I say is just what works for me and is for informational purposes only. Do not attempt anything I say without doing your due diligence with hours of research and trial and error beforehand. That's what I did to develop the system I'm about to explain. Never trade on borrowed conviction. Trust me, that's a sure-fire way to blow up your account. So without further ado, let me get into the details.
Smart people learn from everyone and everything. Average people learn from their experiences. Stupid people believe they already have all the answers.
— Socrates
When I Trade
I've been fortunate enough to have other skills that give me income streams outside the stock market. I'm also young enough not to require too much money, so frankly, I only trade because I want to. It genuinely satisfies my intellectual curiosity. This gives me a sense of comfort, but more importantly, it means that I'm in charge of my input to output ratio.
What I mean is if you're trading all the time, is it really worth it? We clearly all love trading or we wouldn't be trying this brutal profession, but there are more important things in life than making money, like spending time with our family or improving our health. So instead of constantly needing to urge to trade, I want to maximize my output for the input I'm giving. This thought process has resulted in me trading in only two scenarios.
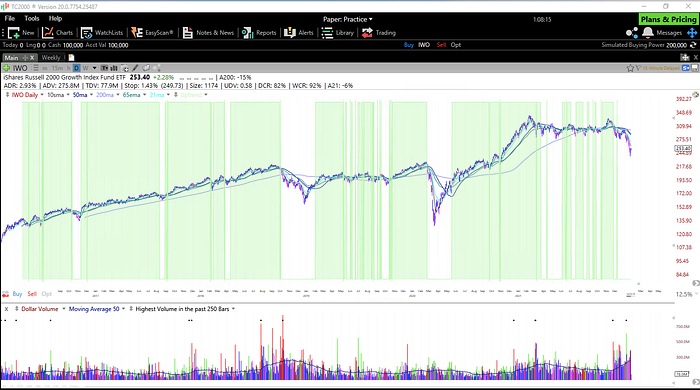
- The IWM, IWO, or any small to mid-cap ETF is in a power trend, rising at a 30–45 degree angle above rising 10 and 20 simple moving averages (SMA). During this period, I want to see higher lows and higher highs form with relatively linear moves, no choppiness, and support at logical price areas like moving averages or pivots.
- My automated scans result in so many names that look incredible that I wish I could buy them all. This environment usually lines up with rule #1, but sometimes it's slightly different as indices are not always the best representation of market breadth.
What's important here is that I trade strictly when the trend is STRONGLY in my favor, and I'm never trying to pick tops or bottoms, just the powerful move in between. Not only does this save financial capital during choppy or down trending periods, but it also saves mental energy as I'm not constantly fighting for pennies against the overall market.
What Type of Stocks I Trade
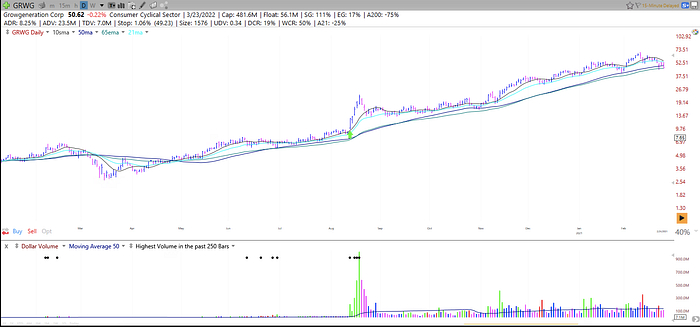
I stick to only the fastest moving liquid stocks that are above a rising 10 and 20-day simple moving averages. The fastest-moving stocks have a high average daily range percentage greater than 5%.
When positioning, I try to aim for stocks that are very early on in their trend. It's imperative not to be too late to the party because that's when you get chopped up. My objective is for my time and money to always be leveraged in the best possible opportunities — stocks where I can potentially double or triple my position in months.
Next, I focus on only liquid stocks that trade above at least 20 million dollars worth of volume a day, ideally much more. This increases the chances of the stock following linear and predictable chart patterns. Liquid stocks are also much easier to hold because there's much less risk of an institutionally-owned name going straight to zero overnight.
Linear, non-choppy price action means that the stock finds will likely find support at logical levels. The chart will be very clean and easy to look at, ideally making higher highs and higher lows. If you take one thing away from this entire post, you must focus on the strongest stocks in the strongest markets, positioning heavily in an easy place to manage your risk.
So much of what I've talked about for stock selection is technical analysis based, not fundamentals. And the truth is I don't care too much about the financials for my shorter-term holding periods (a few weeks to a few months). Everything metrics-wise is often already priced in on the stock, and my edge does not improve whether I know the financials or not.
Sometimes knowing the financials can even hurt your performance as you forget to manage your risk and end up holding the bag. I don't have any problem with fundamental research, but too many people will use it to buy setups that aren't perfect. Always make sure every time you buy a stock, it's something you can write home about from a technical analysis perspective — that's how strong the chart it must be for you to know your time and money are in the right place.
To limit my most gap down risk, I have a rule never to trade penny stocks, any stock with a price less than 3, or a market cap of fewer than 300 million dollars. Though I have my favorites, I do not box myself into specific sectors. Whether it's an oil company or a revolutionary new technology, the chart will tell me if it's something I can make money on.
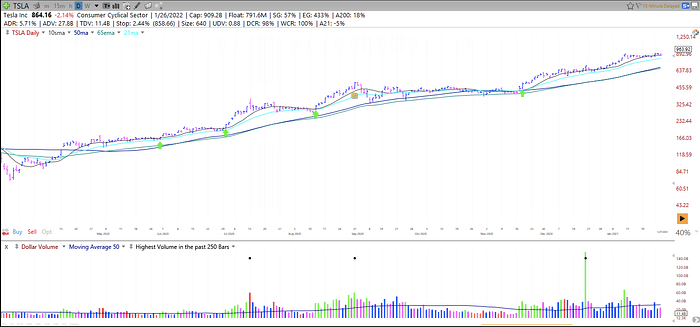
Examples
What Setups I Trade
I'll split this section into three parts: momentum breakouts, EPs or episodic pivots, and anticipation plays. This is also the order I think in which it's best to learn each one and master first. None of these setups require any technical indicators and are purely based on price/volume action.
Moreover, these setups have been around for hundreds of years, and they will continue to be around for hundreds of years because stock charts are just a reflection of supply-demand and human psychology, laws that never change. That's why knowing these recurring patterns is so important because once it becomes second nature to spot and exploit them, you can make money almost effortlessly.
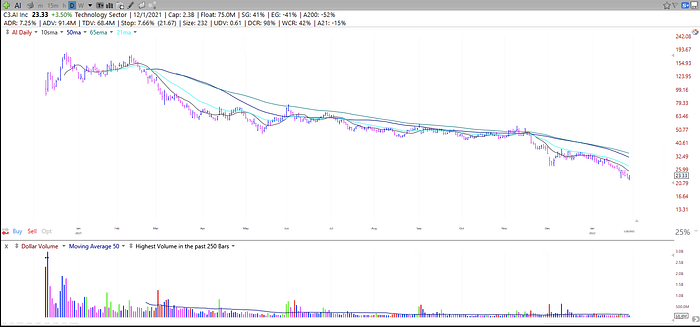
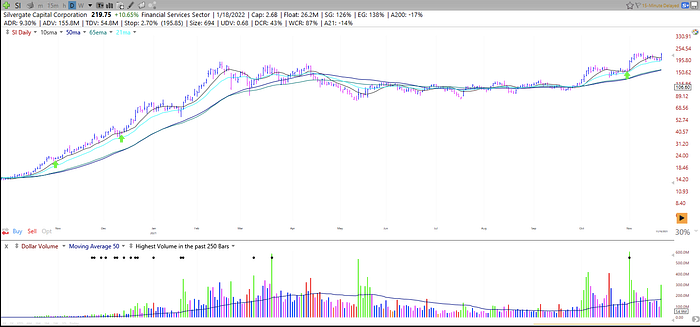
Momentum Breakout
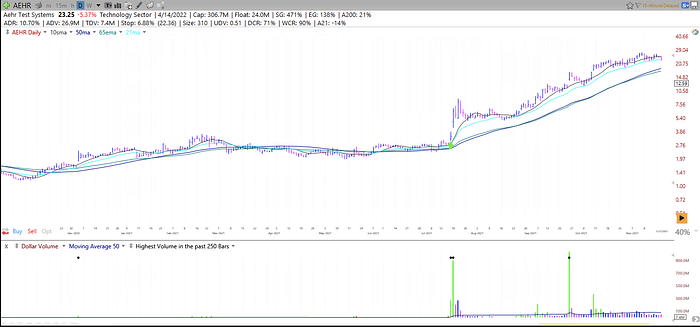
A momentum breakout occurs when a high-flying stock has a few weeks short consolidation period and proceeds to break out of the range to the upside. The stock must have previously made a very explosive price advance, and just before the breakout is moving sideways above the 10, 20, and 50-day simple moving averages, building an area where it's easy to define my risk. Defining my risk involves putting my stop loss at a level that, if violated, will make the setup void for the time being.
During the mini-base in which the price moves sideways or gradually lower, I want to see volume decrease. The volume should subsequently pick up as soon as the stock breaks out of the base. The breakout refers to the bar in which price moves above most if not all the recent highs. I will buy on that bar itself, setting my stop usually at that day's low.
I draw a trendline (either horizontal or descending) connecting the recent highs and set an alert when the price breaks above it to make this process quick. I'm trying to enter right when the trendline is broken, which is hopefully the signal that the stock can make another explosive move. This is the setup I use most often because it is simple and frequently occurs on a high-quality basis.
Examples
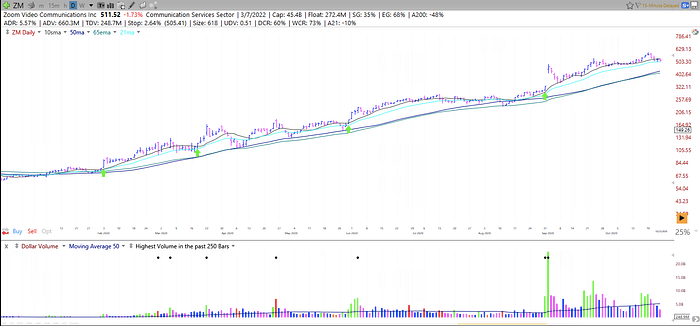
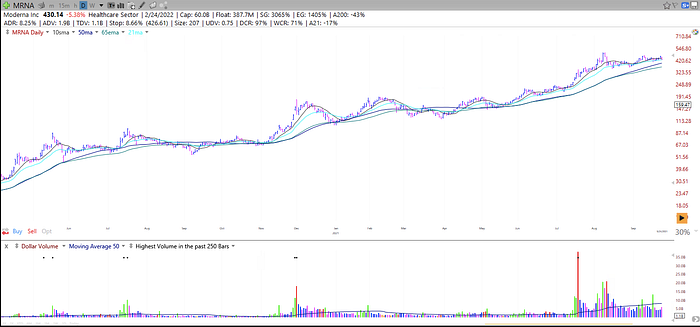
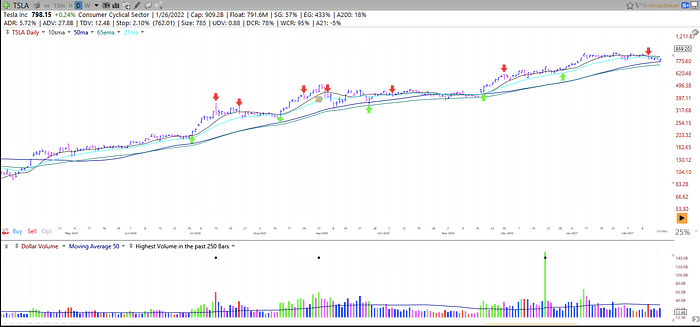
Episodic Pivot
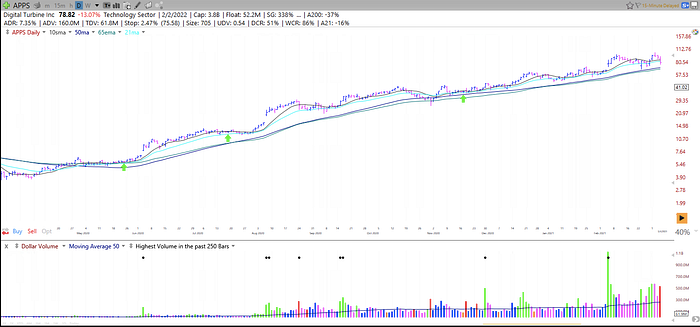
There are probably only a handful of good episodic pivots every year, but they can provide life-changing returns. An episodic pivot does not require the stock to be in an uptrend previously. The setup works best if the stock is actually moving sideways or neglected (but not in a severe downtrend). An episodic pivot essentially refers to when the story around the stock has changed, resulting in explosive price moves. Let me set the stage for you.
The stock price is just chopping around, zig-zagging sideways and is overall an ugly mess — nobody can agree on what the company is worth. Then suddenly, breaking news comes out, whether it be a surprisingly great earnings report, government partnership, FDA approval, or anything else, and the stock has become revitalized. It is now gapping up 30% after-hours and hitting headline news. The entire story around the stock has now changed, and everyone wants a piece. The only problem is there's not enough stock to switch hands in one day. Institutions are quite literally scrambling for more. They can't establish a hundred million dollar position in a day, which creates a sustained uptrend for weeks, months, and maybe even years off of the transformational news. Our job is to position as quickly as possible once this setup occurs and then ride the trend higher as long as it lasts.
The first day of the EP usually results in an explosive 10–50% move, often gapping up over months of prior price action on 5 to 10 times the average volume. The higher the percentage gained and the volume on the day, the better. As long as the stock is not in a severe downtrend, a strong enough EP erases all the previous price action and can quite literally turn a laggard into a market leader. To find these, keep a tracker of massive price and volume moves throughout the day and both pre/post-market. Catching one of these EPs on day one, if done right, may mean you never have to sell at a loss.
If I find a stock making a significant advance in pre-market or after-hours, I will first check the news and ensure it is truly game-changing. For example, blowout earnings or sales surprises of 100+ percent often lead to wonderful EPs. Then, assuming it qualifies as a true EP based on my research, I will establish a position the following day on an opening range break, setting my stop at the day's low and letting it ride. Here's a video of Dan Zanger explaining the opening range breakout with examples.
Sometimes, I miss the first day of movement in an EP and can't find a reasonable risk to reward position intraday. This is rare, but occasionally the stock moves too fast. In this case, I do not forget about it and move on. I keep this stock on my high-priority list and try to sniff out entries in the following days with tight stops wherever I can.
For example, I love to draw a horizontal line at the close of the EP day and see how the stock reacts to that level. Occasionally, the stock will slowly drift down to that close, and then you can take a position at that level using as a stop. If the stock isn't respecting the close of the EP day, sometimes it respects the high or the low, so you could use that instead.
Essentially, I try my best to get into the stock in any way possible with proper risk management. Go back in time and look at any monster stock; the entire move likely started on an episodic pivot day like blowout earnings (ex: GOOG in 2004).
Some Important Notes about EPs
- Sometimes you can end the day up more than 20% on the position, and it's tempting to take profits right away, but I would advise against selling your entire position too quickly. Trends off EPs can last for much longer than you could ever think.
- Because the stock is usually gapping up enormously in an EP, it's difficult to position heavily since there are usually no obvious levels to manage risk, but try to be creative with your entries.
- Not every high volume big price gain day is an episodic pivot. Look to see if there's an actual story change with tangible news. This can provide a reason for institutions to keep buying hand over first.
- The first EP in every stock is usually the most powerful if earnings-related. If it happens again in the subsequent earnings cycles, you should not position nearly as heavy and be ready to take profits much more quickly. At this point, the stock is already well known and it's no longer like finding a lost gem.
- Any mature stock above 50 billion dollars in market cap or already trades massive daily dollar volume doesn't qualify for a true EP. This setup is all about finding new leaders. A good rule of thumb is to focus on stocks with a market cap of under 10 billion.
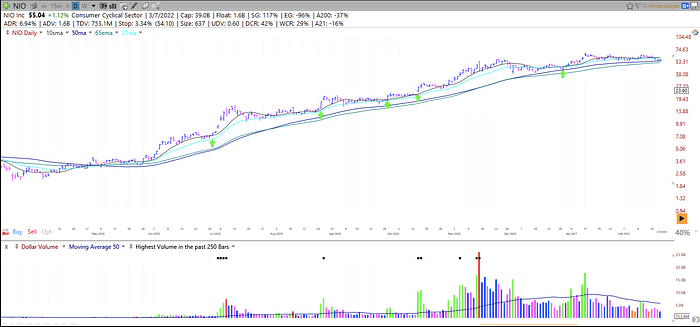
Examples
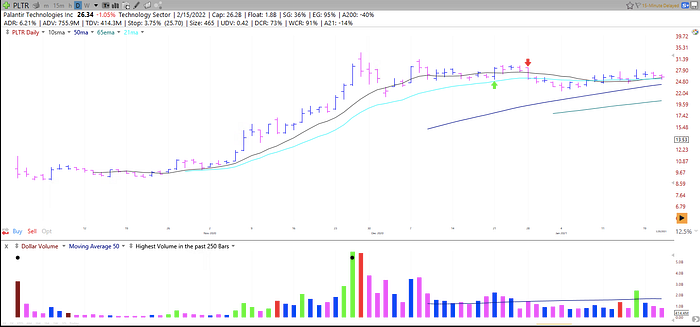
Anticipation
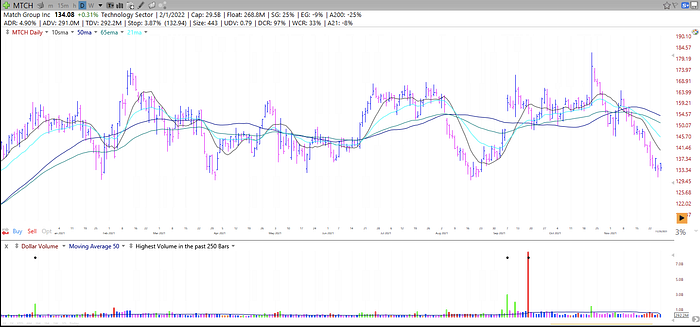
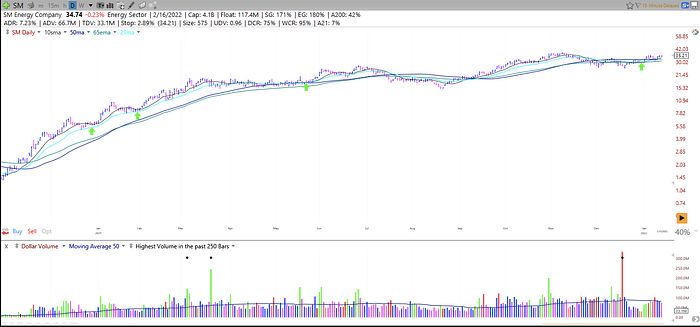
Lastly, the anticipation setup is something I use to position heavily into a monster stock without risking much capital. How is this possible? I look for the same characteristics as I do in my momentum breakout strategy. So a high-flying stock has a short consolidation period in the context of an uptrend, and the probabilities are stacking it will once again breakout to the upside.
The stock must have previously made a very explosive price advance and is now moving sideways above the 10, 20, and 50-day simple moving averages, building an area where it's easy to define my risk. Then in this process, it puts a ridiculously tight candle, often moving less than 0.5% on the day with the volume significantly lower than usual. This means for that particular day, the supply and demand dynamics in the stock have reached equilibrium. There is a lack of supply (low volume) and demand (slight price movement), so any change in the two over the following sessions can create powerful moves.
I love this setup because I can set my stop at the low of the day, which is often less than 0.5% risk and results in excellent risk-to-reward mechanics. It's not that effortless though, as the cost of anticipating means you are entering without confirmation.
The stock can break either to the upside or to the downside after the very tight trading day. The key is to maximize the probability of the setup working by entering early in the trend of a stock with all the characteristics of super winners that I mentioned before (support at logical areas, liquidity, linear moves, etc.).
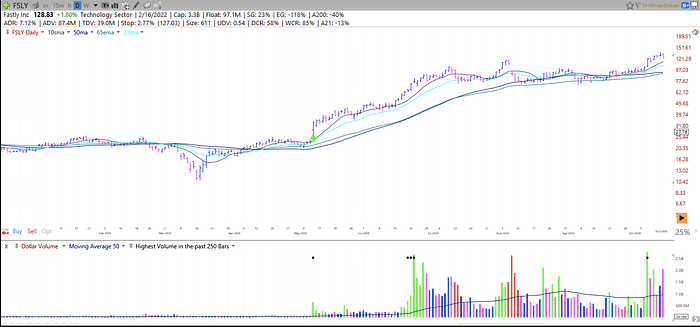
Examples
Note About Setups Section
What I mentioned above about my setups is not in spectacular detail. I was purposely vague in some terminology because I want you to figure out the nuances of what works for you, not just rely on what I say. I detailed the essential points on what and how I buy stocks with examples; now it's time to make it yours. Discipline is overrated in trading. Creativity is much more critical. How well can you develop your unique edge in the market?
Additionally, I have used examples from the 2020–2021 market, but the returns shown were heavily inflated due to the high liquidity environment and the Fed's unprecedented quantitative easing. Stocks were making moves that would previously have taken multiple years in just a few short months. Do not expect future returns to match the examples I have shown — it's not all that easy.
Selling Stock
Buying right can indeed solve half your problems, but even if done right, it's only just half. The other half of the equation is managing the position you already have. Ask any trader; figuring out when to sell is likely the most challenging part of the job.
As an active swing and occasionally position trader, it's essential to use stop losses. In the volatile stock market world, stops are the closest thing to insurance for your money. I never set a stop loss to more than 5% from my entry price. For the setups I trade, I usually keep my stop at the low of the day that I entered because if the stock violates that level, then the setup is probably void for the time being.
If a stock stops me out quickly, I'm happy — at least I didn't waste any time. I lose money on close to 50% of my trades because I keep my stops rather tight to avoid significant losses (the nemesis of most amateur traders is their ego which makes them take substantial losses). I keep my average gain on any trade more than five times my average loss, so the math of profitability works in my favor even though I win and lose at the same frequency.
An excellent way to instinctively know whether you should take a trade is to ask yourself if I am stopped, was it still a trade I couldn't pass up on? When you fully accept the risks of buying a particular setup, you are okay with whatever happens next.
If the stock doesn't stop me out, the other two outcomes are either it moves sideways or higher. If it moves sideways and the chart is intact, I will not be in a rush to close my position. There's an important exception, though. If the stock starts to act sluggish and slow, it may signal that the uptrend may be over. A good example would be if the market is moving higher and you bought a stock well but it's not confirming upwards (essentially underperforming). In that case, if it repeats over a few sessions, I might cut it and move capital over to another setup.
On the other hand, if the market is moving down, and my stock is moving sideways after I bought it, that's an example where it's bullish. Anything moving sideways for more than 4–5 days, though, is usually a sign that the stock is just not ready yet. Keep in mind these setups are designed so that the stocks move in a direction quickly after you buy them.
It seems a little counterintuitive, but the most complicated type of selling for me is when the stock moves higher after I bought it. In this scenario, I will usually sell anywhere from a third to a half of my position after 3–5 days. Then, I move my stop up aggressively to just below any logical levels of support. Given the stock is trending above the 10 and 20-day simple moving averages, I will only exit the position entirely after it decisively violates the 10SMA on a closing basis. So if the stock gradually pulls back on lower volume and closes below the 10SMA for a day on lower volume, I will not panic sell. I want to see a negative character change and a close below a previously respected level. A good example would be if a stock has been closing above the 10SMA, but then one day out of nowhere, it drops 10% with high volume and slices through it). It doesn't have to be that dramatic, but just any change in behavior of the stock that is evident if you zoom out on the daily chart and look at the move in its entirety.
It's tough to act logically when the market is falling apart, but the guardrails I put in place (keeping initial stops tight, taking profit quickly, and trailing stops higher) make it so that these one-off days do not cause me to lose control. I have always planned out how I react to every situation in advance, so it's more of me simply executing what's happening in the market instead of responding in real-time and making poor emotionally-charged decisions.
Examples
Position Sizing and Portfolio Allocation
Position sizing and portfolio allocation refer to the amount of capital you use on each trade. Sizing heavily (more than 20% of your account) into a single trade without losing sleep requires firm conviction in your ability to execute a setup. That conviction comes from thousands of hours of studying and practicing with real money in the markets. Do not expect to have the confidence to take large position sizes without first putting in the hard work. Once you have reached a certain ability level, the right position sizing and portfolio allocation can take your performance to new heights.
For me, I put anywhere from 12–25% of my account into each trade on average. That means, in a textbook bull market, I will have 4–8 positions at any time. Position sizing is often dependent on how far your stop is from your entered price. For example, if I entered at 100 dollars and my stop is at 95 dollars, I'm risking 5% on that position. I limit any trade to just 1% total portfolio risk to limit the risk of drawdowns. That would mean in this specific case, I am only allowed to put up to 20% of my account in the stock. Likewise, if my stop is only 2% away from where I entered, I can theoretically put 50% of my account into the trade. This is rare, and I often do not put more than 30% of my account into a single trade.
I recommend beginning with 10% position sizes and about ten names in your portfolio (assuming you use stop losses less than 7%). First, it sets you up for success as your focus is dialed in on fewer positions to manage. Moreover, I found 10% is the sweet spot between getting enough exposure to reap the benefits and not enough to where you are stressed over losing everything.
It's essential to scale up or down your trading depending on how your overall portfolio changes. When you decide stop losses or position sizing, stick to percentages instead of dollars.
Journaling
I keep track of my thoughts everyday pre and post-market. This keeps me level-headed and open to many different outcomes. It reminds me everything can change in one day (ex: black Monday) and ensures that I am never too bullish or bearish.
I also document in a Google Sheet every one of my trades in real-time, including why I bought, how much I bought, what time I bought, and at what price. This seemingly small action has numerous benefits.
First, it ensures I'm not acting on FOMO as I'm forcing myself to take accountability for my actions. Explaining why you want to take a certain trade in simple terms seems more complicated than it looks.
Second, the sheet has built-in functionality that calculates and keeps me informed about my trading statistics (average gain, average loss, win rate percentage) which is integral to knowing whether you are making any progress.
Last but not least, it keeps me in tune with the market. If I get stopped out on three new positions in a row, that's a sign that the market may be extended and not suitable for long entries. Then I can quickly adjust my trading according to the data, either by taking profits quicker, using smaller position sizes, or stopping trading altogether. Likewise, early in an uptrend, I need to make sure my test buys are working and that my equity curve shows it. Are stocks fading after big moves or seeing follow-through?
These analysis and self-reflection questions make sure that I am always aligned with the action going on in the market and my ability to exploit it. These daily habits can be the difference between keeping you out of trouble when market conditions aren't right and doubling your account when a power trend is on.
Tools and Resources
TC2000 is a platform that will have pretty much everything you will ever need for trading purposes. This includes charting, screening, and post-analysis. I also use TradingView because of its simplicity on mobile and FinViz for its flexibility. I use Python programming for automating my scans and backtesting my strategies. For journaling, I use my notes mobile app and for tracking my trades, I use Google Sheets.
Books have been an integral part of shortening my trading learning curve. I listed below five books that were very helpful in developing the basis of my trading style, but feel free to look around for any others. These are the ones that spoke to me; it may not work for your risk profile or timeframe.
- Trade Like a Stock Market Wizard by Mark Minervini
- Think and Trade Like a Champion by Mark Minervini
- Reminiscences of a Stock Operator by Edwin Lefèvre
- How I Made $2,000,000 in the Stock Market by Nicolas Darvas
- How to Make Money in Stocks by William O'Neil
YouTube has also been a great learning resource and below, I will list a few channels that I religiously watched when I was seeking consistency in the markets.
- Stockbee — https://www.youtube.com/c/Stockbeevideos
- Richard Moglen — https://www.youtube.com/c/RichardMoglen
- Qullamaggie —https://www.youtube.com/user/Qullamaggie
- TraderLion — https://www.youtube.com/c/TraderLion
As with everything else, take everything you learn with a grain of salt. Test all assumptions and create a solid foundation for yourself to develop conviction.
Conclusion
That's close to 90% of what you need to know about my specific swing and position trading process. Remember, the simpler, the better. Maximize the efficiency across every facet of your trading, even if it means automating your scans or setting up notifications for breakouts.
Focus on just price, moving averages, and (dollar) volume. No fancy indicators are required and there are no holy grails.
Get to the first principles of ever commonly held belief, find mentors, study for thousands of hours, and put skin in the game when testing your hypotheses to learn as quickly as possible.
You want to use your time, mind, and money in a very select manner in the stock market, or it can and will take them all from you.
Thanks for reading!
If you enjoyed this article, check out some of my other articles below!